Web data, like a pile of bricks, holds potential but lacks structure. Grepsr helps businesses build a complete picture – the house of knowledge.
In this case study, a leading healthcare provider in Dubai needed insights at the community level.
They required POI data of healthcare facilities and demographic information, including income data, visualized on a map!
Grepsr’s innovative solutions tackled challenges like missing zip codes and unavailable income data, delivering actionable insights that empowered the client to make strategic decisions.
Actionable Insights
- POI and Geodemographic Data: A healthcare client required granular details on Dubai’s points of interest (POI) and demographic data at the community level. They also requested a map visualization of this.
- Challenges: Due to the lack of postal or zip codes in Dubai, data precision is complicated. Additionally, public availability of community-level income data is limited.
- Innovative Solutions: To address the data challenges, Grepsr deployed innovative methods. This included leveraging latitude and longitude data (GeoJSON format) and utilizing average rent as a proxy for income at the geographical region level.
- Actionable Data: Finally, we created an interactive map for the client which provided insights into income distribution, market gaps, competitive analysis, and community-level details.
- Client Satisfaction: The project enhanced the client’s strategic decision-making capabilities, demonstrating Grepsr’s commitment to customer satisfaction and adaptability.

POI Data
POI (Point of Interest) data includes key locations like schools, restaurants, tourist attractions, hospitals, luxury hotels, and more. This data is vital for industries such as real estate, tourism, and ride-hailing, helping businesses grow and succeed.
Geodemographic data, similar to POI data, combines geographic and demographic information to profile individuals and households based on location. It includes not only age and gender but also socioeconomic factors like income, employment, and education, as well as behavioral and housing attributes.
Today, we’ll explore a real-life case of a leading healthcare service provider in Dubai who sought unique POI data. We’ll delve into their specific requirements, the challenges we faced, and how Grepsr’s experts delivered innovative solutions, ultimately fostering a strong client relationship through collaboration and creative problem-solving.

Requirements
The requirement of the client was POI data of healthcare facilities across Dubai plus how the population interacted in those areas, meaning geodemographic data of those people. The location data of healthcare facilities included pharmacies, clinics, and hospitals from each community of Dubai.
Insights from these data points are critical for their business in identifying market gaps where healthcare facilities aren’t utilized. They can strategically enter the areas where there is little to no supply of healthcare services aiming to increase their revenue, market share, and contribute to economic growth in those regions.
Actionable information from geodemographic and POI data assists the client with their optimum allocation of resources like medical staff, equipment, and related inventory in those facilities.
Understanding demographic patterns and trends in the area makes sure that the resources are efficiently utilized where they are most needed.
Additionally, with access to the data that includes the location of competitors’ services in different regions, they can craft strategies to outperform them in sectors where they are falling behind.
The point is, by also having the knowledge of competitors’ activity, the client could refurbish their positioning and pricing strategies to capture an even larger market share and boost profitability.
But for a comprehensive understanding of the healthcare sector and the population, they didn’t just want the data in a structured CSV, JSON, or XLS file. That’s our expertise but they requested it to be visualized by plotting the data points into a Dubai map.
Putting the Proof of Concept into Action
Grepsr is known as one of the top data extraction and web scraping service providers. Quality data at scale, swift turnaround time, and in-depth expertise in the world of web scraping are what we represent.
While the project focused heavily on data acquisition and analysis, our success also relied on effective post-processing and visualization to translate the data into clear and actionable insights.
The client requested us to visualize the POI data of healthcare facilities across Dubai by plotting them into a map. So, we got to work.
We took a sample from our existing database and visualized it with the help of our data visualization experts. Then sent that as a proof of concept to the client.
Pleased with the proposed solution, they gave us the green light to proceed.
Bottleneck
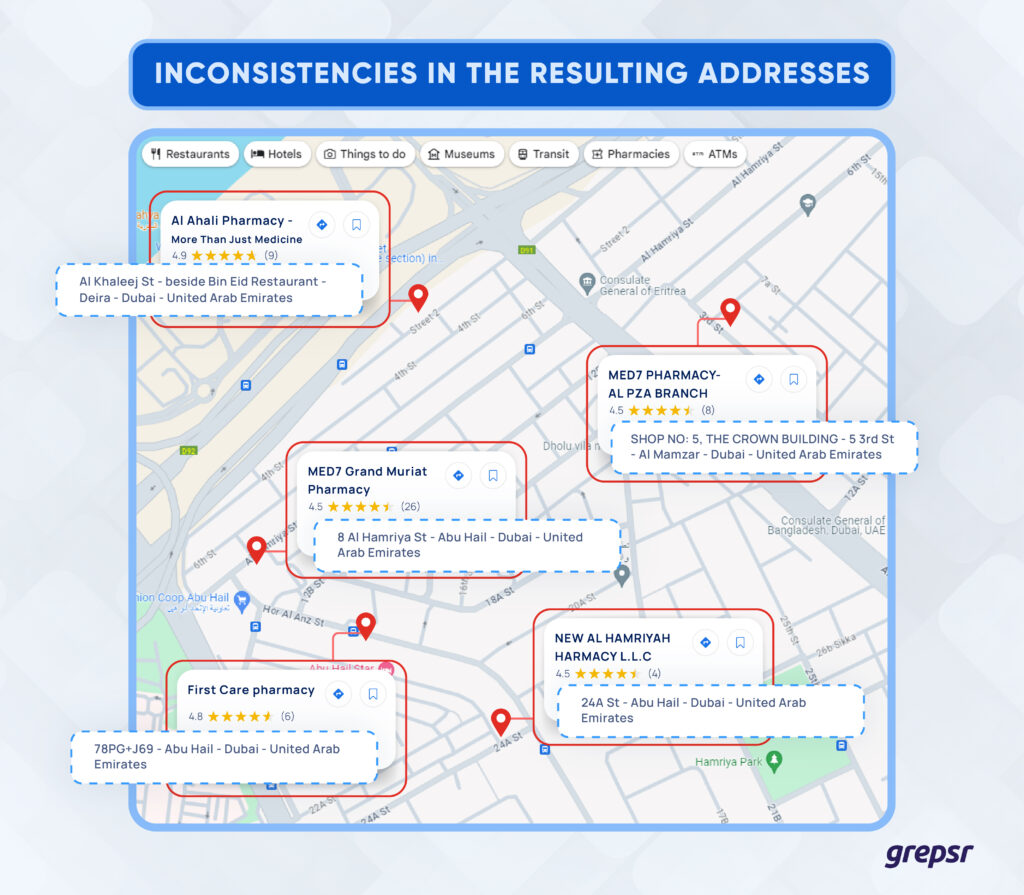
The client had requested POI data of healthcare facilities from the community level of Dubai. However, the entire UAE including Dubai doesn’t use either a Postal code or a Zip code which is an important parameter for pinpointing the exact addresses of a certain area.

As you can see the inconsistencies in the resulting addresses that appeared in Google Maps from the same community.
Now you can imagine how not having a zip code made this project more cumbersome. Causing challenges in extracting accurate community-level data with precise addresses of healthcare facilities.
So, we set out on a path of exploration yet again to find a way of getting accurate and high-quality datasets of POI data from the community level.
Blueprint
The usual industry procedure for extracting POI data involves entering specific keywords and categories to obtain exact addresses. However, this process isn’t always 100% accurate. In this case, the resulting addresses could include nearby communities from other states rather than being limited to Dubai.
Thanks to our expertise in POI data extraction, we already had a solution in place. To enhance the precision and accuracy of the data, our team used GeoJSON data to meticulously define the boundaries of each community in Dubai.
With this, we ensured the results were 99.99% accurate, which helped us earn our client’s trust.
Finally, we could move on to solve the real problem at hand.
Gordian Knot
The biggest challenge from the beginning was the indispensable requirement of income data of the population from each community of Dubai.
Why was this a Gordian’s Knot for us? Well, we are a web scraping service provider that extracts public data from publicly available sites and web pages.
And if you didn’t know, income data at the national level is easy to find but the community level is very difficult and not public in most of the cases.
So what could we do now, considering we were locked in between the devil and the deep blue sea?
Cutting the Gordian Knot
We put our thinking caps on. Turns out we needed to think like an economist.
The theory of supply and demand applied to the housing market suggests that the price of a good or service is determined by the interaction of supply (how much is available) and demand (how much people want).
In areas with high income, people generally have more money to spend on housing/rent.
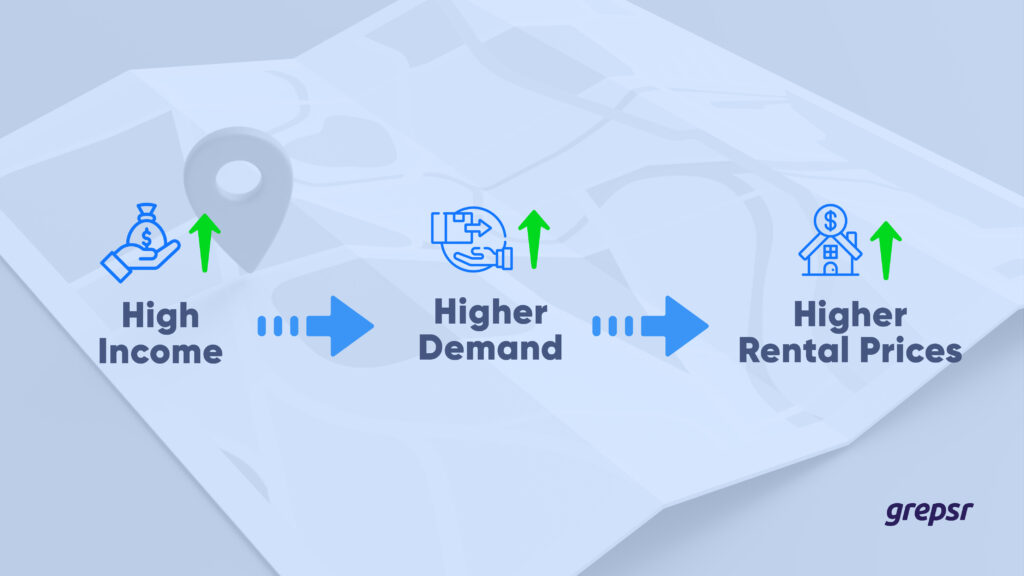
Then we thought, why not use rent as a proxy to estimate the incomes of the population from specific communities?
Let’s understand this more clearly.
Due to high income, there is an increase in spending power which translates to more people wanting to live in the area, raising the demand for housing/rent.

Hence, high income leads to higher demand for housing, which, leads higher income individuals to live in higher rent and higher property priced areas.
We explained this concept to the client comprehensively.
Through open communication and data exploration with the client, we decided on this solution. We proposed using rental data from Bayut, the UAE’s leading real estate portal, as a potential proxy for income levels within targeted communities.
This innovative approach resonated with the client, as it offered valuable insights traditionally unavailable due to missing zip codes and limited income data.
We then created a choropleth map highlighting the average rent per square foot and plotted the POIs of healthcare facilities.
Visualization Insights
From this map, the client could decode several actionable insights.
- Income distribution and healthcare access
Employing average rent as a proxy for income, the map shows income distribution across different communities. This helps the client correlate the availability of healthcare services with the higher or lower incomes in the area.
- Market gaps and opportunities
The map reveals insights into market gaps where there’s a mismatch between the population’s income levels and the presence of healthcare services. Then they have the opportunity to expand their services to those areas.
- Competitive analysis
The interactive visualization had the information for all healthcare facilities in the vicinity, providing a comprehensive view of the market landscape and allowing for effective competitive analysis.
- Community-level insights
The interactive map shows precise and detailed community-level insights with the POI’s name, address, state, community, ratings, etc. together at once. This enables granular analysis and ensures that decisions lead to better-targeted strategies and interventions.
Thus, with the meaningful data presented after making sense out of the noise, the client can now glean insights ready for decision-making—building a functional house from individual data bricks.
Final Thoughts
This case study demonstrates Grepsr’s proficiency in leveraging POI and geodemographic data to empower healthcare service providers. The client required POI (Point of Interest) data of healthcare facilities from community levels plotted on an interactive map.
This presented a valuable opportunity for Grepsr to collaborate further and showcase our expertise in data visualization. However, the request for average income data of the population of the specific area posed a challenge.
Nonetheless, Grepsr overcame this challenge through innovative methods such as using GeoJSON data for accurate results. Plus, leveraging the average rent rate as a proxy for estimating average income levels.
The project demanded us to push our boundaries, adapt, and think out-of-the-box solutions. This ultimately resulted in accurate, actionable data that satisfied the client’s requirements and enhanced their strategic decision-making capabilities.
At Grepsr, we’re on a continuous learning journey. We constantly explore new methods to navigate the complexities of data challenges.
Facing a similar hurdle? We understand – data can be tricky! Let Grepsr be your fellow explorer, helping you unearth valuable insights hidden within.
Take the first step towards data-informed decisions – chat with Grepsr today!


