Search here
Can't find what you are looking for?
Feel free to get in touch with us for more information about our products and services.
Grepsr’s creative approach to data refinement helps brands expand into new markets

Any data is only as good as the insights derived from it. However, before we begin the analysis, the data must be put through adequate pre-processing techniques that standardize, aggregate, and categorize the dataset.
As we’ve mentioned in our previous article that explores the importance of data refinement, most data scientists spend 50 to 80 percent of their time refining data.
At Grepsr, we have several QA checks to guarantee the speedy refinement of your data. The two use cases described in this article should give you enough insights into our data refinement procedures.
We’ve helped numerous brands expand into new territory by providing them with up-to-date data in real time.
Since enlarging your operations requires serious consideration on several fronts, i.e. geographic feasibility, data pertaining to specific criteria, competitor’s standing, etc., the data you work with demands rigorous scrutiny.
Our strong QA checks enable our clients to make the best decisions. The processes listed here ensure high-quality data for downstream analysis.
Case I
Client requirements: Extract any and all CF Moto dealership data, exclusive to France.
Field requirements:
Product name, Dealer name, Address, City, Geographic details (latitude and longitude)
Overview: The brief was pretty straightforward. We needed to extract a particular dataset from a specific geographic location, i.e. from a single country. When scraping data on such a massive scale, it is natural to come across some undesirable elements. This is an account of how we rectified that problem.
Phase I : Data extraction
Our developers get to work and scrape the required dataset. The following sample shows the result of that effort.

As you can see, several data points in this dataset have values that sit at loggerheads with the client requirements. Then it brings us to the next phase.

Phase II: Data issue detection
Once all runs are complete and the data is ready to be reviewed, our QA team gets to work and begins analyzing the dataset to discover contaminations. Depending upon the nature of client requirements, we use various data analytics and visualization tools to identify and correct data issues.
In this case, the QA team was able to find the most glaring data inconsistencies by visualizing the dataset. Clearly, we had several pieces of information from outside the vicinity of France, which we didn’t need.
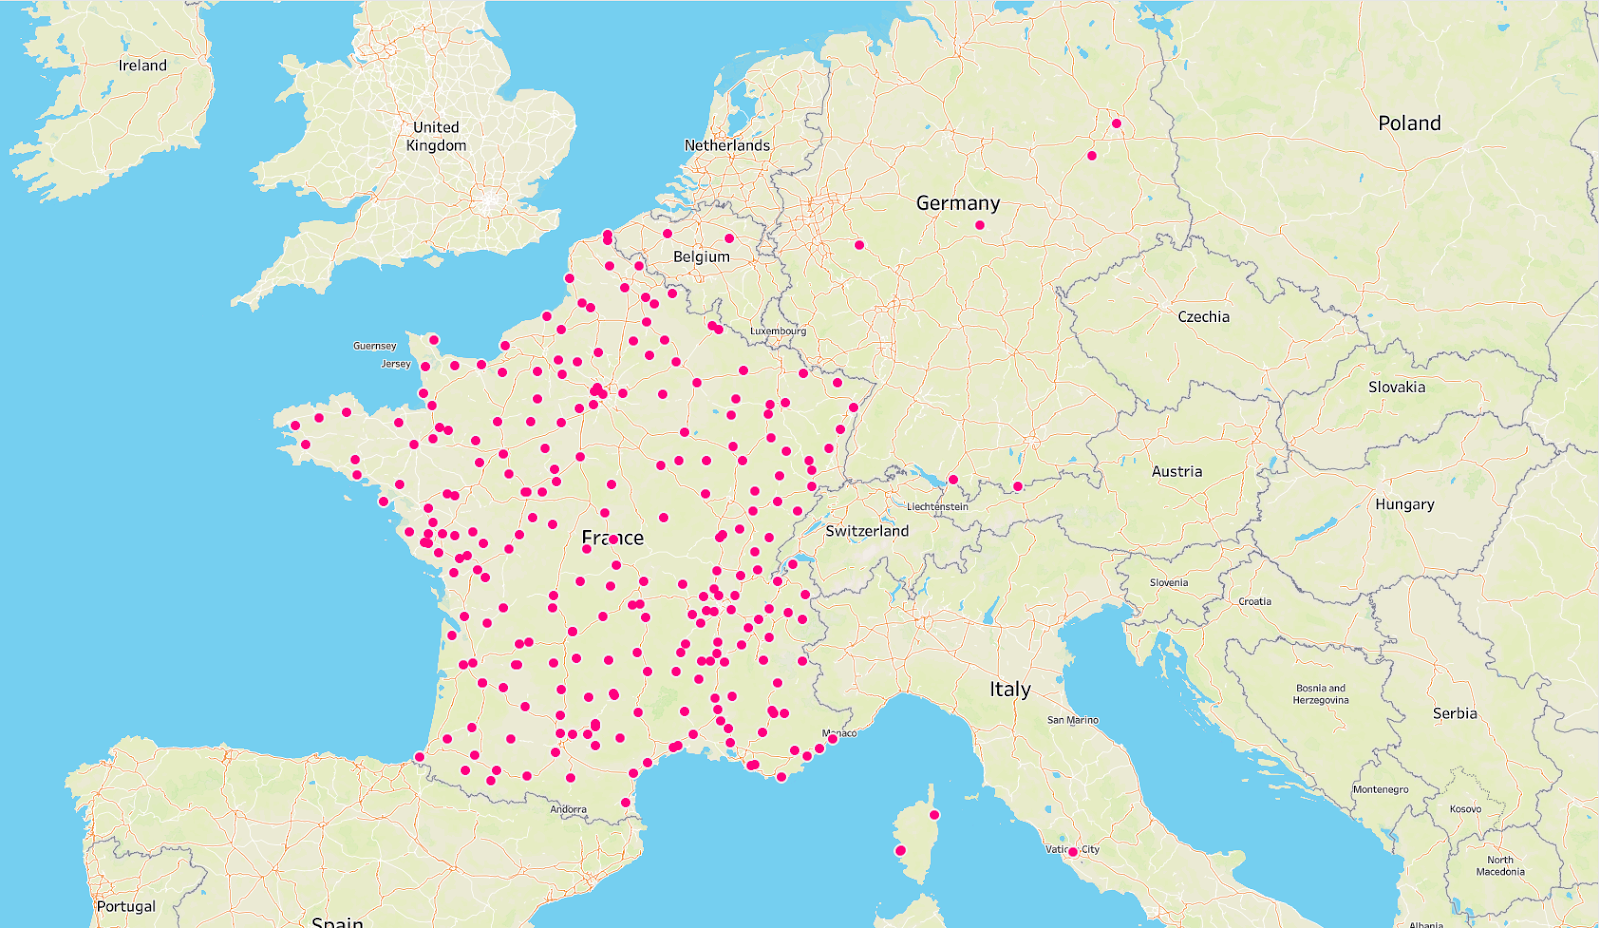
Insights gained: The data is not fit enough to be delivered, yet. The QA team sends it back for reinspection.
Phase III: Data refinement
Now, fully aware of the problem, the developers set out to refine the data. Armed with insights obtained from the previous exercise, the Delivery team generates another dataset.

Phase IV: Data issue detection
The QA team verifies whether the data extracted in the second round has the same issues as before. We could have used a variety of methods to determine the verdict, but for this, we used data visualization once again.
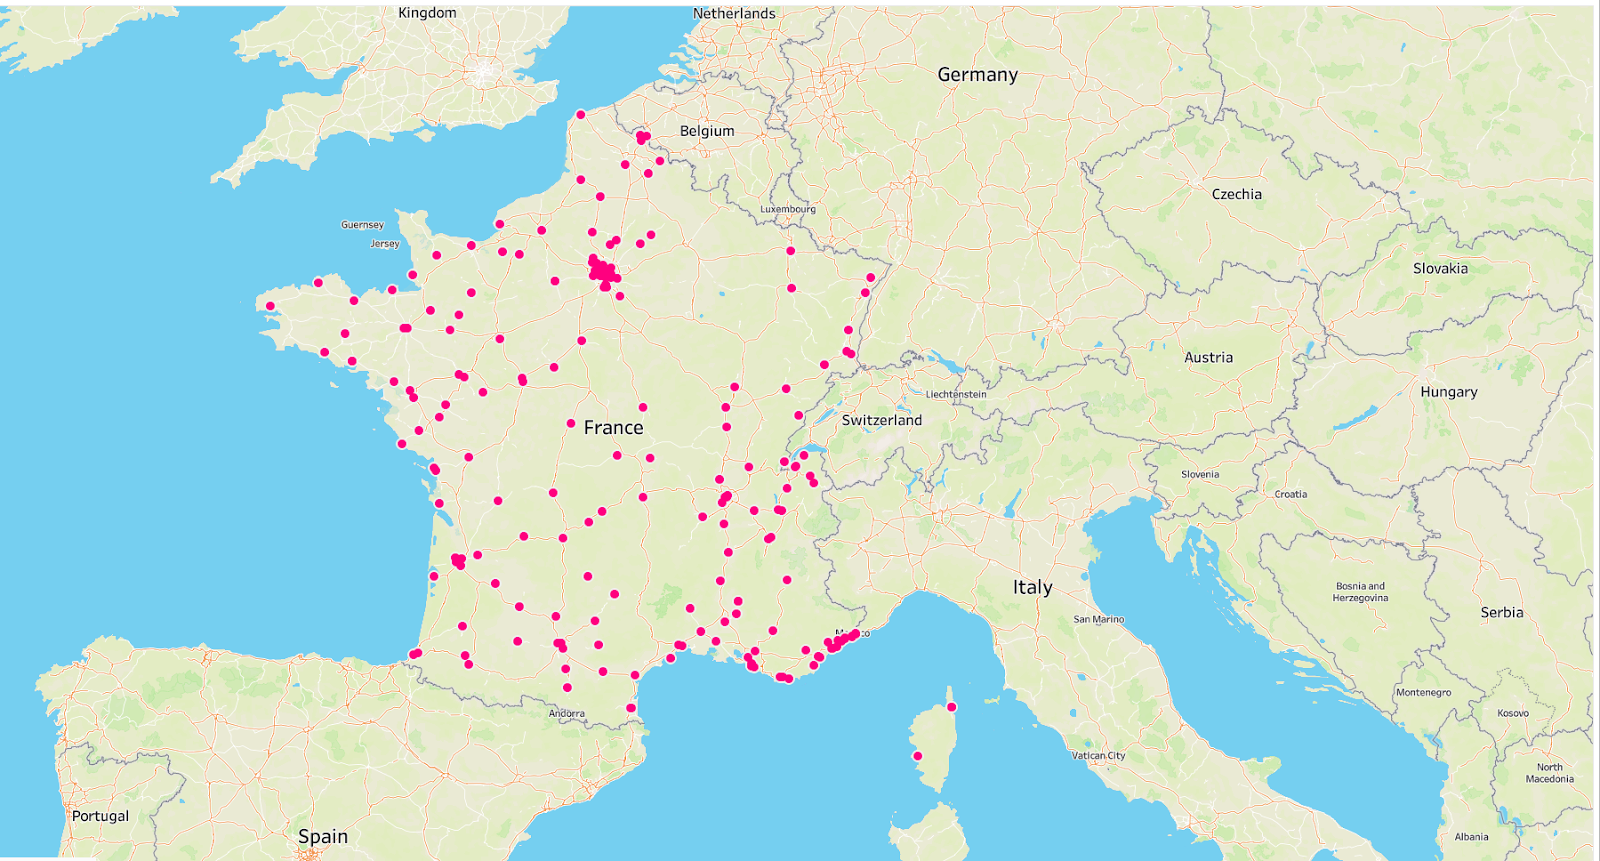
It is easy to see that the dataset no longer consists of CF Moto dealerships outside of France.
Phase V: Data Delivery
The map indicates the high quality of the dataset. Afterward, the Customer Success team sends it over to the client for immediate deployment.
Case II
Client requirements: Extract any and all Yamaha motors dealership data from the UK.
Field requirements:
Product name, Dealer name, Address, City, Country, Email address, Website details
Overview: Similar to Case I, the client needed dealership data of a particular brand from the UK. As before, we witnessed problems arise after the first round of extraction. This time around, our approach to data refinement was slightly different.
Phase I: Data Extraction
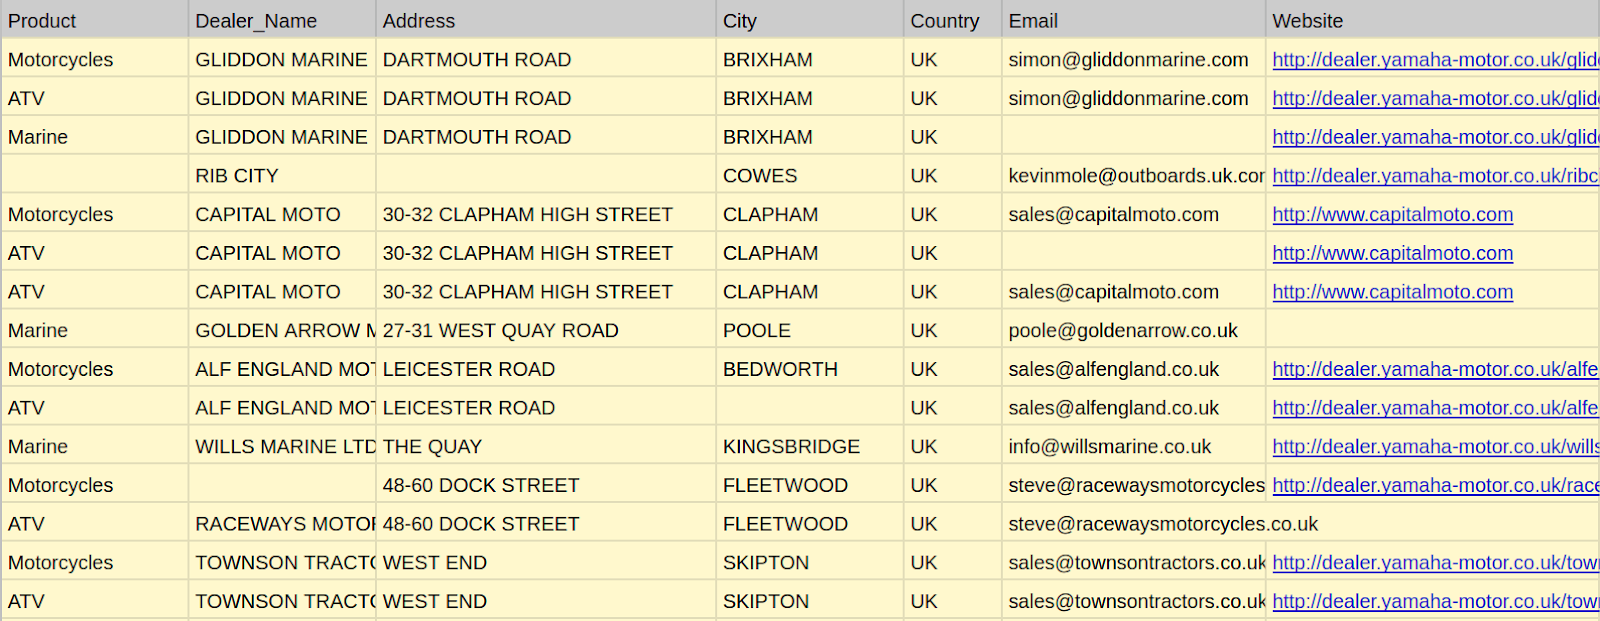
Our developers set out to scrape data.
Phase II: Data issue detection
The QA team discovered a lot of issues with this dataset. For this use case, we used the dataprep library in Python for analytics. The generated report provides clear insights into the issues of the dataset.
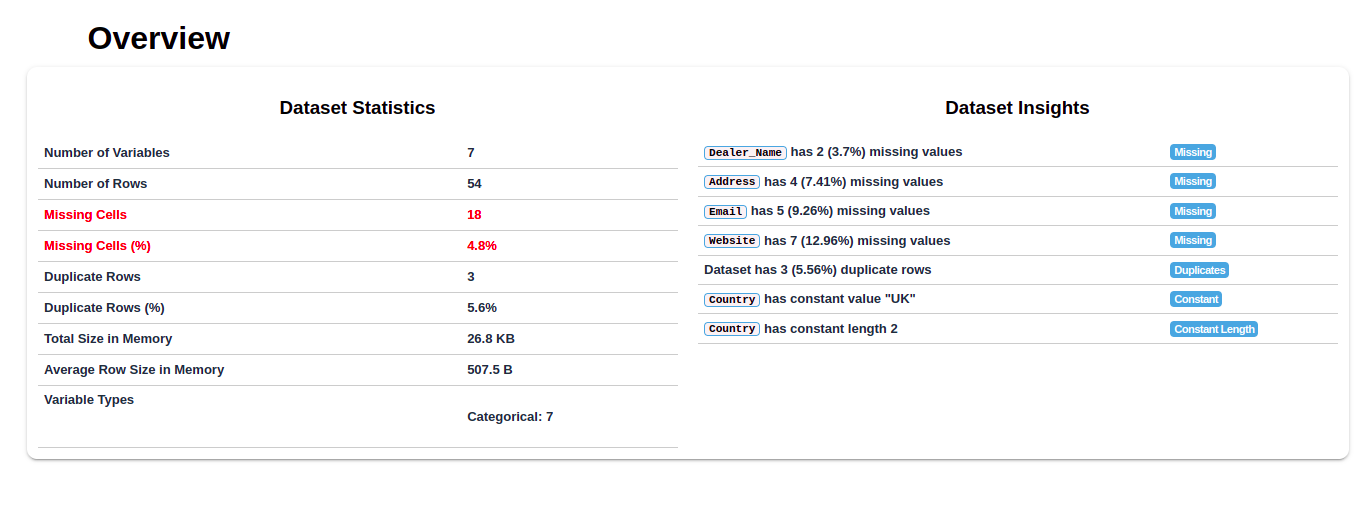
As you can see, the report shows the discrepancy between the number of rows and columns, missing cells and values, as well as the percentage of distortion.
For more in depth analysis, you can also see a visual summary of each variable.
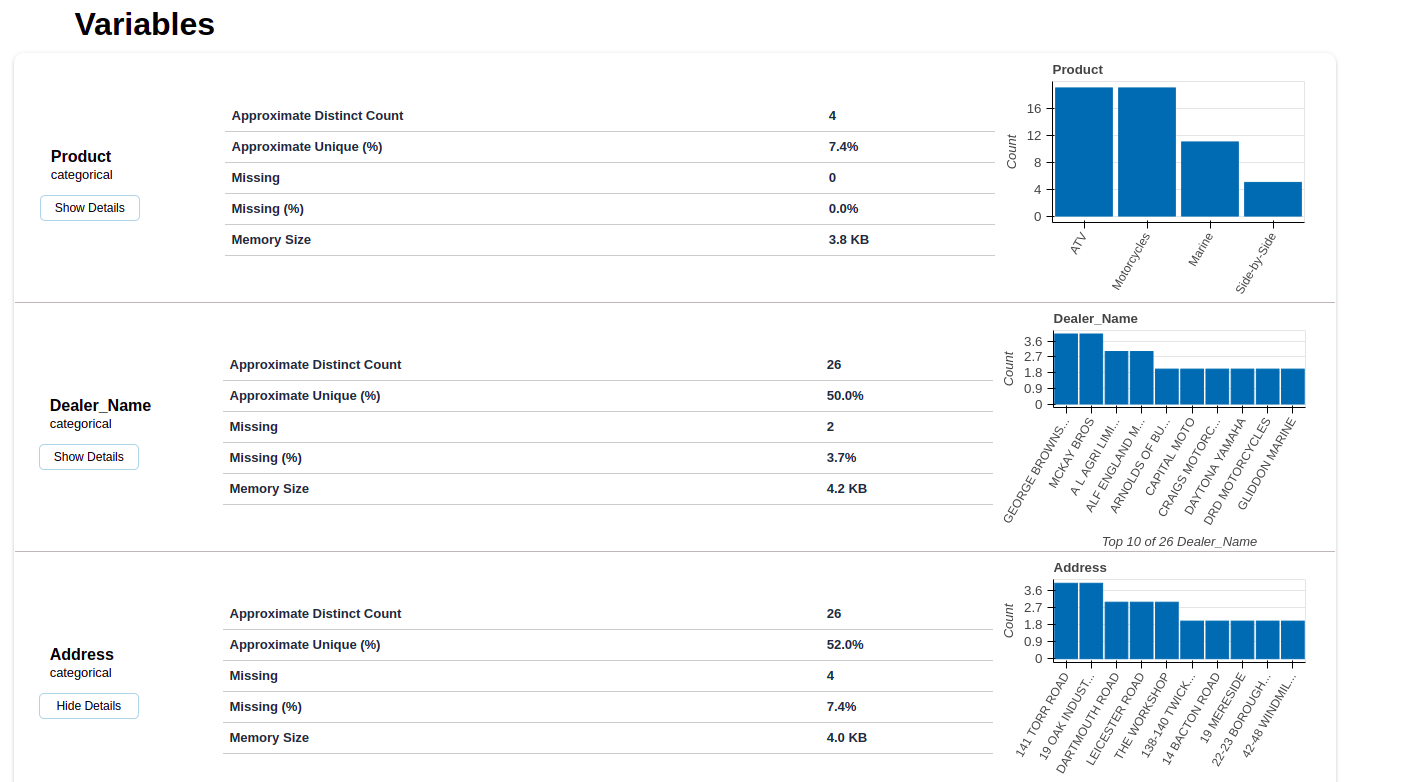
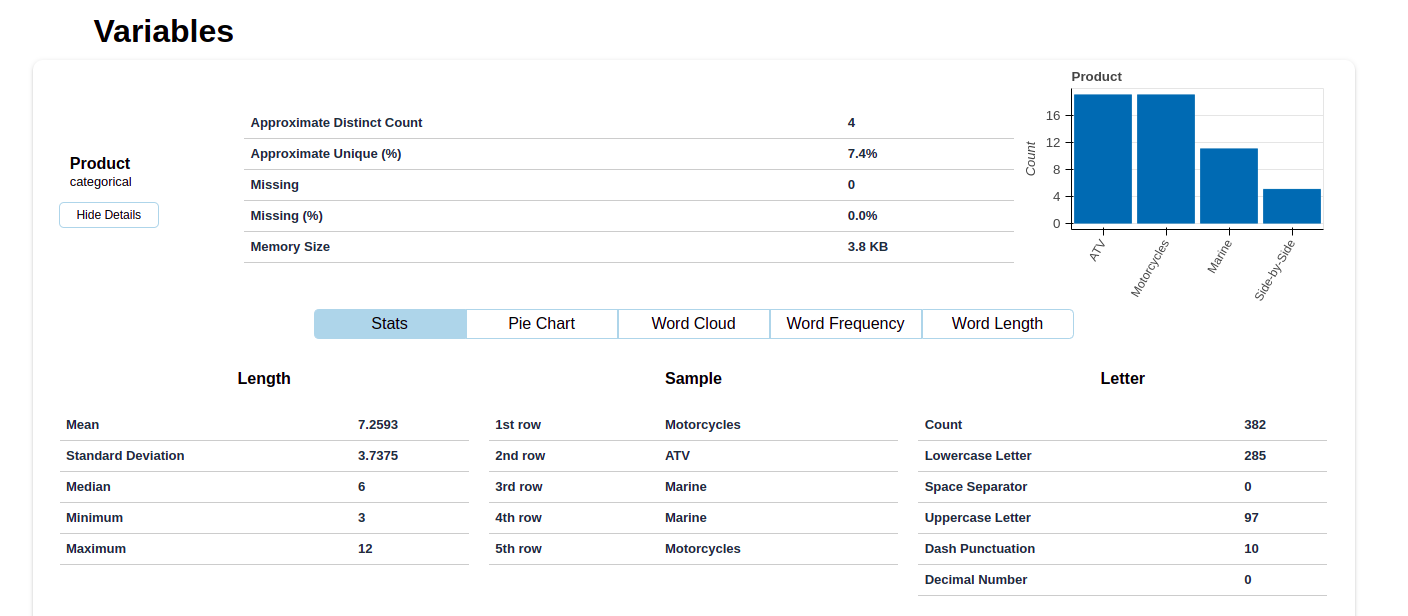
A detailed section for each variable category allows you to view the overall statistics of that particular category.
The QA team located several discrepancies in the dataset. Then, it’s sent to the Delivery team for reinspection. The following bar graph gives them a visual representation of missing values for each variable.
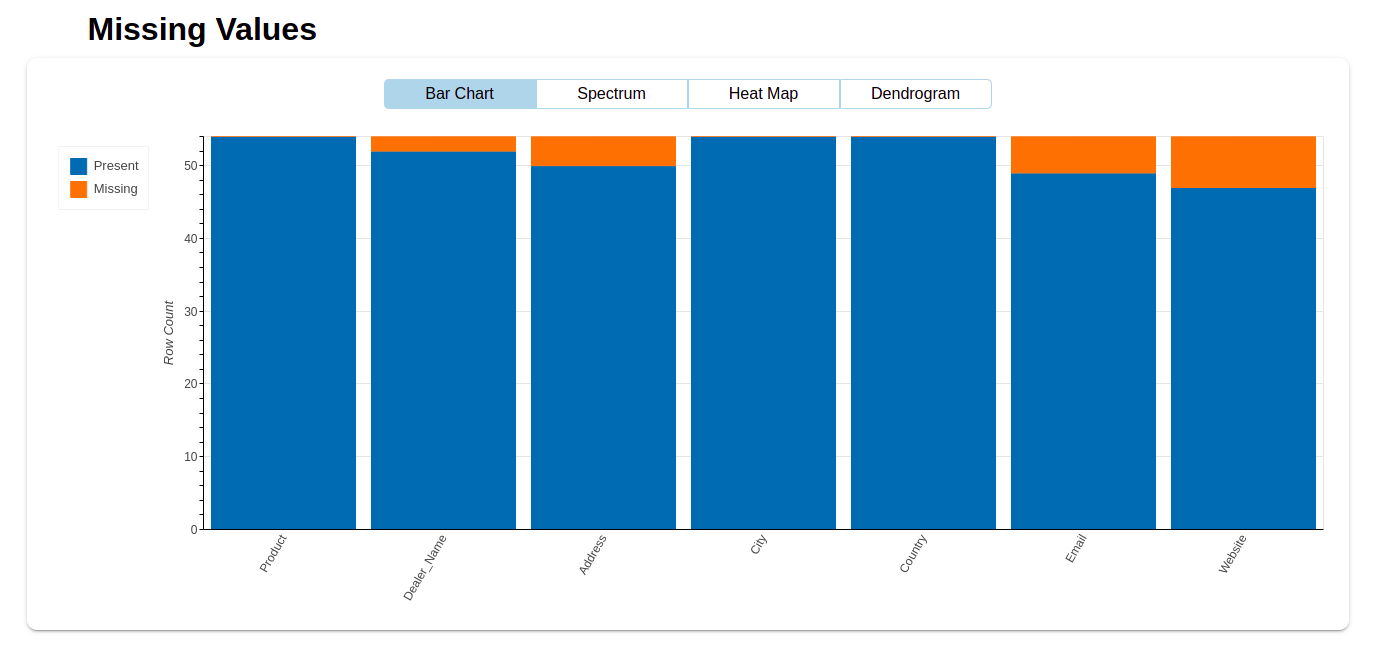
Insights gained: Compared to the issues of Case I, we discovered more problems in the dataset after the first round of extraction. There were a lot of missing values like dealer name, email, and website details.
Phase III: Data refinement
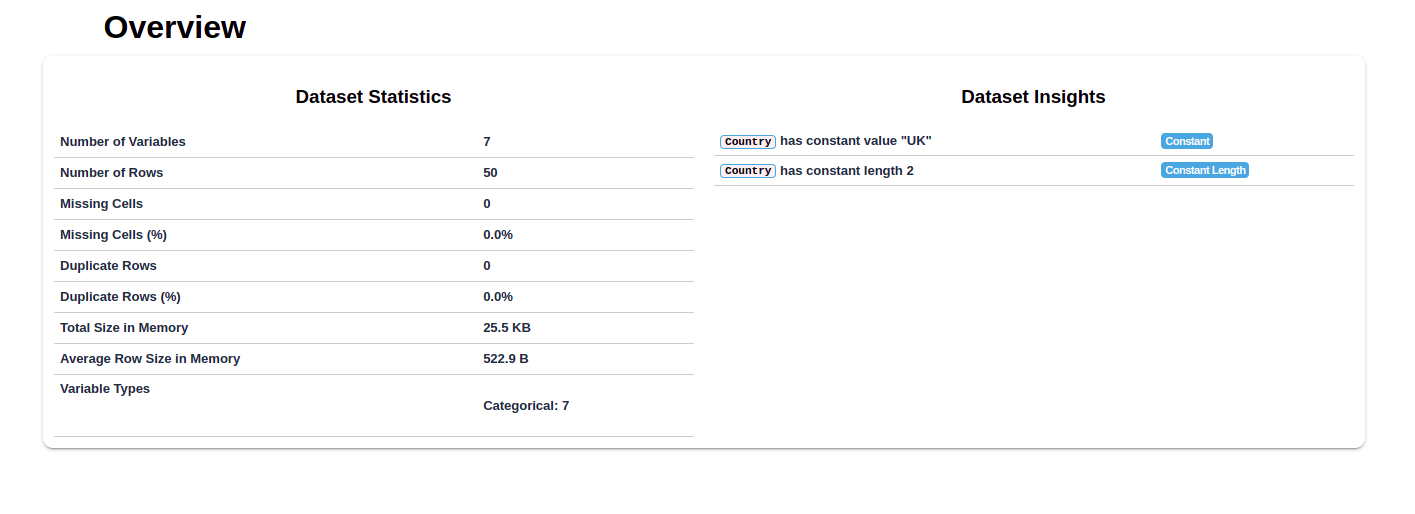
With a clear roadmap laid before the Delivery team, there was nothing left to do but make the necessary changes. Then, the Delivery team sent another dataset to the QA team after the second round of data extraction. Thankfully, there were no errors this time. The following report fully substantiated the accuracy of our data.
Phase IV: Data Delivery
The Customer Success team now sends the data to the client. Finally, it can be deployed immediately.
To conclude
Most of our clients have one thing in common. Their data requirements are all unique. Naturally, we employ different QA checks to guarantee the integrity of their data.
We perform manual and automated QA processes to ensure the quality of your data. Furthermore, our robust data platform supports multiple data formats and delivery destinations. Seamless integration with popular platforms like Amazon S3, Google Cloud, Azure, etc., is a non-issue.
While data refinement demands a lot of manual work, as long as it delivers high-quality data, nonetheless, we do it for you.
Related reads:


