
Search here
Can't find what you are looking for?
Feel free to get in touch with us for more information about our products and services.
Geographical locations or POIs are not entities that last for posterity. We collected NYC POI data to decode the various dynamics that may help executives make informed decisions within the backdrop of impermanence.
Drawing inspiration from the ‘philosophical entertainer’ Alan Watts‘ thoughts that the more permanent a thing, the more lifeless it becomes, our case study immerses into the dynamic essence of New York. All through a focused analysis of Points of Interest Data.
Our study zeros in on New York, examining POI data there to uncover valuable insights for businesses navigating the dynamic urban terrain. Cities evolve, and the understanding of these changes is important to adapt and grow.
You can leverage POI data to analyze the pulse of modern cities, and gain actionable intelligence to thrive in the fast-moving business landscape.
NYC POI Data Actionable Insights
If you are pressed for time, here are quick actionable insights you can review on-the-fly.
-
- Starbucks’ Strategic Clusters: Explore how Starbucks strategically places its outlets near key transportation hubs in Manhattan, capitalizing on high foot traffic for busy New Yorkers.
-
- Dunkin Donuts Dominance: Uncover the surprising revelation that Dunkin Donuts outnumbers Starbucks 3:1 in New York, reflecting a strong preference for Dunkin among locals.
-
- Monday Peaks in NYC: Gain insights into the peak foot traffic times in iconic locations like Rockefeller Center and Times Square on Mondays, providing strategic advantages for businesses in these areas.
-
- Cultural Expression Through Establishments: Discover how establishments in New York express their cultural identity, with Jamaica and China emerging as top-represented countries.
-
- Gucci’s Strategic Outlet Placement: Learn how luxury brand Gucci strategically aligns its outlets with affluent per capita income zones, reinforcing the connection between high-end brands and upscale neighborhoods.
Decoding NYC through POI Shots
Often regarded as the modern counterpart to Rome’s historical grandeur, New York is one of the world’s most culturally diverse cities. Ethnic enclaves and neighborhoods dot New York’s landscape and enrich its identity.
We sought to collect the POI data from New York with a twofold goal in mind: unveil nuanced insights into the intricate social tapestry of the city, and concurrently, articulate the compelling business propositions arising from monitoring such data.
What follows is a detailed exploration of our discoveries and insights.
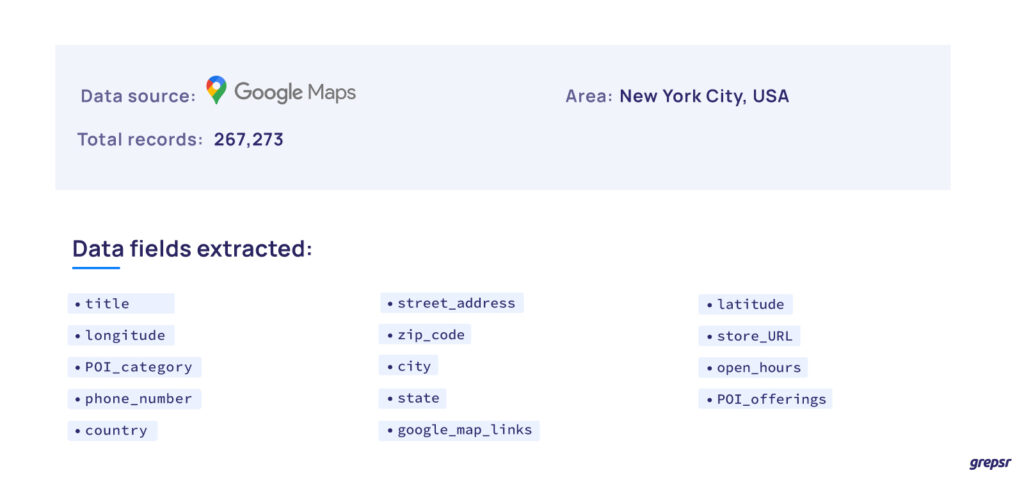
Dataset Overview
1. Starbucks’ Savvy: Caffeine Convenience at Transit Hubs
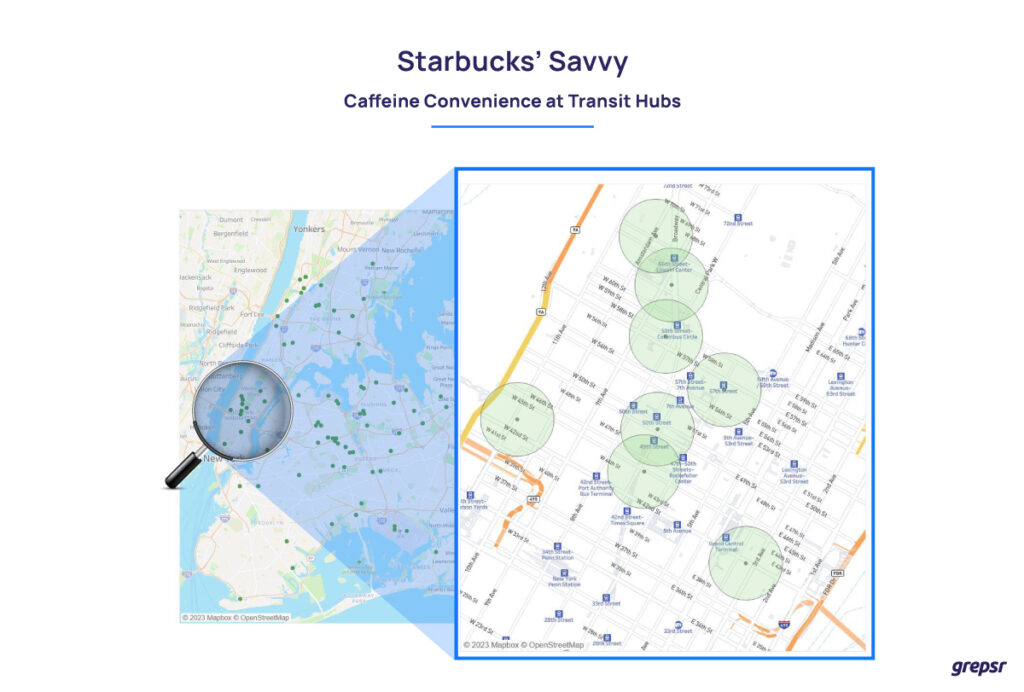
We analyzed Starbucks locations across Brooklyn, Queens, Manhattan, and Bronx, focusing particularly on Manhattan. Furthermore, we employed a 0.18 mile radius around each Starbucks location in Manhattan.
No particular reason to do this except that the shortest distance between any two Starbucks locations in the area was 0.18 miles.
With exception to a couple of distant Starbucks outlets located on 42nd Street and 3rd Avenue, the primary clusters are notably concentrated around the intersections of 49th, 50th, and 57th streets, as well as the area encompassing 59th and 60th streets.
It’s interesting to observe that these clusters strategically position themselves in close proximity to key transportation hubs, such as train stations and highways.
As any New Yorker knows, these locations buzz with high foot traffic, a constant hustle and bustle of individuals commuting to and from work. A Starbucks in these bustling spots becomes a quick and convenient pitstop for those navigating the demands of a busy day.
This raises the intriguing question of the customer volume at the two outlying Starbucks “outposts,” situated on the far ends of the city grid.
One can’t help but wonder how their customer flow compares to the bustling traffic near highways and train stations. Surely, the need for a quick caffeine fix extends beyond the core of city activity to those farther reaches.

2. Dunkin Dominates: New York’s POI Data Reveals Dunkin Donuts Outnumber Starbucks 3:1
Delving into the intricacies of Point of Interest (POI) data unveils invaluable insights into the strategic placement of businesses, a vital tool for effective competitive analysis. In our exploration, we zeroed in on the New York area, comparing the POI data of two coffee giants – Starbucks and Dunkin Donuts.
The revelation was swift and unmistakable: Dunkin Donuts boasts a more extensive Point of Interest (POI) footprint across New York, outpacing Starbucks in sheer numbers. The Starbucks to Dunkin Donuts ratio is starkly evident at 1:3, with a staggering 79 Starbucks establishments juxtaposed against 241 Dunkin Donuts outlets.
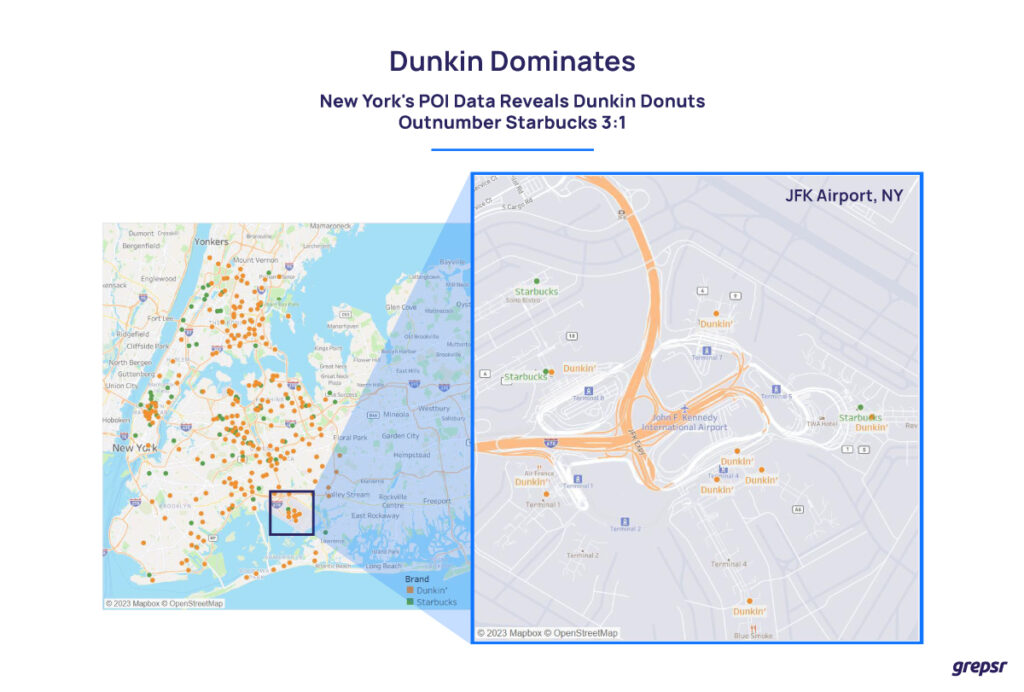
Zooming in for a closer look, we honed in on the JFK International Airport, meticulously mapping out the locations of Starbucks and Dunkin Donuts. The Dunkin Donuts dominance persisted across all terminals, with a robust presence, while Starbucks could only claim a single outlet near terminals 5 and 8.
The question arises: Is there a prevalent preference among New Yorkers for the coffee-and-donut combination? The data strongly suggests so, painting a picture of a city that leans toward Dunkin Donuts in its caffeinated and confectionary choices.
Starbucks likely employs advanced tools to analyze traffic patterns and gather demographic and psychographic data specific to each location, aiding in informed decision-making.
However, from where we are standing, it appears that Starbucks is leaving money on the table.
3. Monday Peaks: Unraveling Rockefeller Center’s High Occupancy and Time Square’s Significant Surge
Based on our data analysis, we observed that on Mondays, the Rockefeller Center registers its highest occupancy levels, particularly between 4 PM and 5 PM, showing a notable peak during these hours. A careful examination of attendance records or surveillance data collected during these time frames indicates a substantial increase in foot traffic.
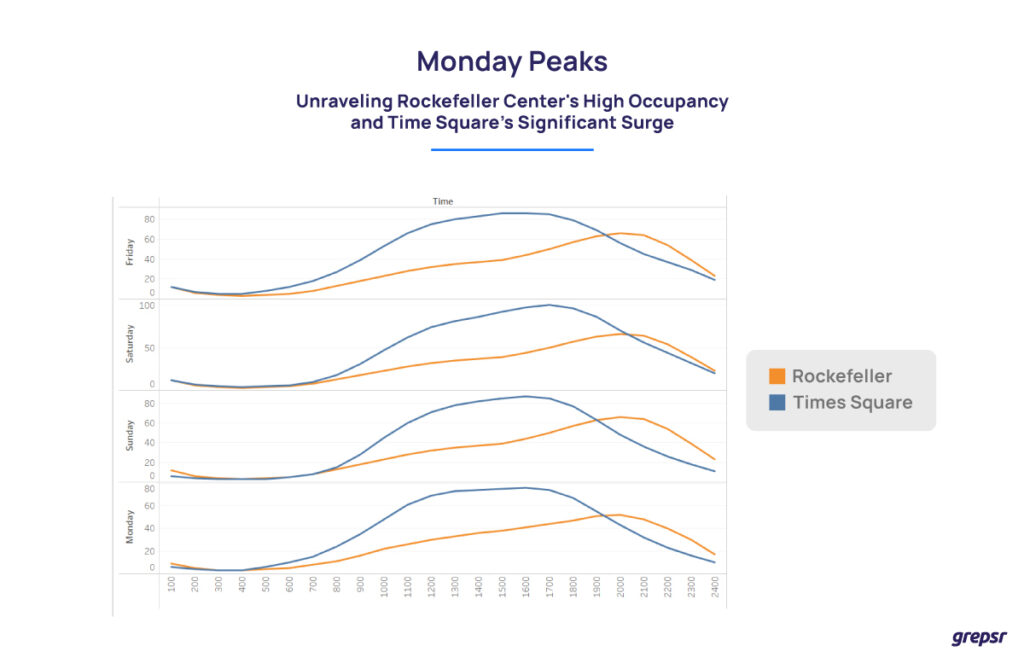
Similarly, Times Square experiences a significant surge in activity around 8 PM on Mondays, reflecting a noteworthy peak in visitor numbers during that period.
The data visualization presented above is part of a broader comparative analysis involving New York’s Rockefeller Center, Empire State Building, and the Times Square area. Our focus was on understanding visitor patterns during specific time slots, enabling us to draw valuable insights for various business applications.
The implications of this analysis extends beyond mere foot traffic observations. For businesses situated in these areas, the data provides a strategic advantage for optimizing inventory management.
By aligning inventory schedules with anticipated traffic variations throughout different time periods, businesses can efficiently cater to customer demand, ultimately enhancing their operational efficiency and customer satisfaction.
4. Voices of New York: Jamaica takes Center Stage, China spreads across the Boroughs
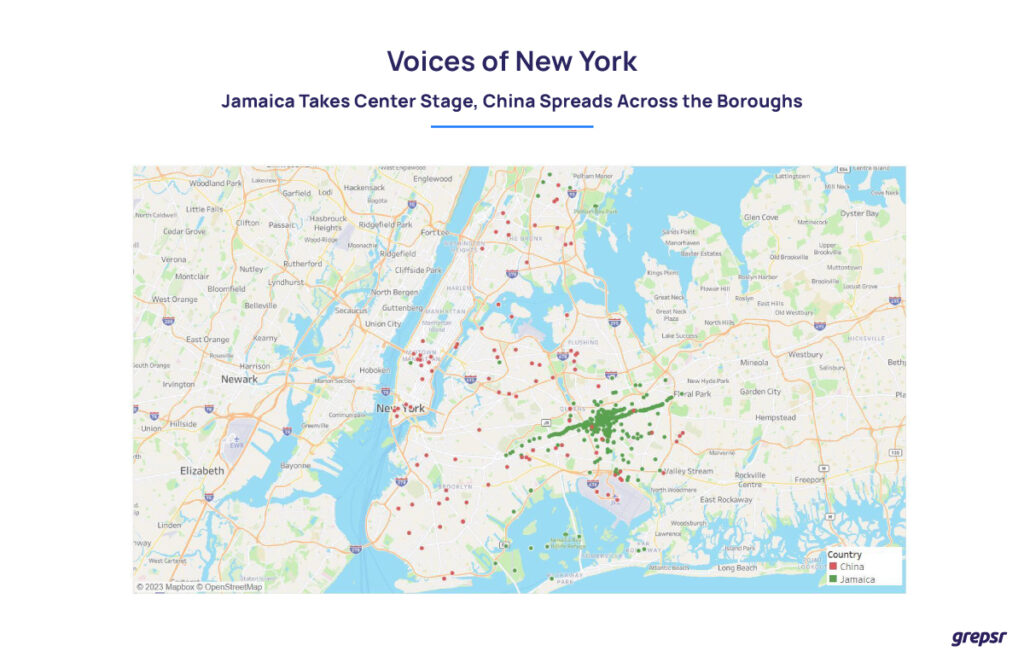
Our research involved the collection of data from diverse establishments across New York to discern patterns in the expression of their respective country of origin. The analysis revealed notable trends, with Jamaica, and China emerging as the top countries represented.
Jamaica stands out prominently in our findings, displaying a robust cultural identity as establishments associated with the Jamaican name dominate the assertion of their country of origin. Interestingly, this trend is particularly pronounced in the Queens area, where a predominantly African-American population resides.
The data suggests a strong affinity among Jamaicans for imbibing their national identity, especially in neighborhoods with a significant African-American demographic.
In contrast, establishments linked to China exhibit a different pattern. Their expressions of country of origin are dispersed across various biracial neighborhoods in New York, indicating a broader and more distributed presence. This diversity in geographic representation suggests a nuanced approach to cultural identity expression among establishments associated with China.
5. Strategic Elegance: Gucci’s NYC Outlets align perfectly with Affluent Per Capita Income Zones
Traditionally, the prevailing notion dictates that luxury brands such as Gucci thrive best in upscale neighborhoods, where residents can comfortably accommodate the premium price tags associated with their products.
Unlike many brands that seek customers organically, iconic brands such as Gucci don’t just wait for foot traffic; they actively generate it.
In our investigation, we meticulously mapped out the locations of Gucci outlets in New York and cross-referenced this information with per capita income data from 2018. Despite the slight time gap, our findings resoundingly validated the initial assumption.
The data unequivocally revealed a striking correlation: Gucci stores are predominantly situated in areas characterized by a robust per capita income range, spanning from $37,200 to $461,000.
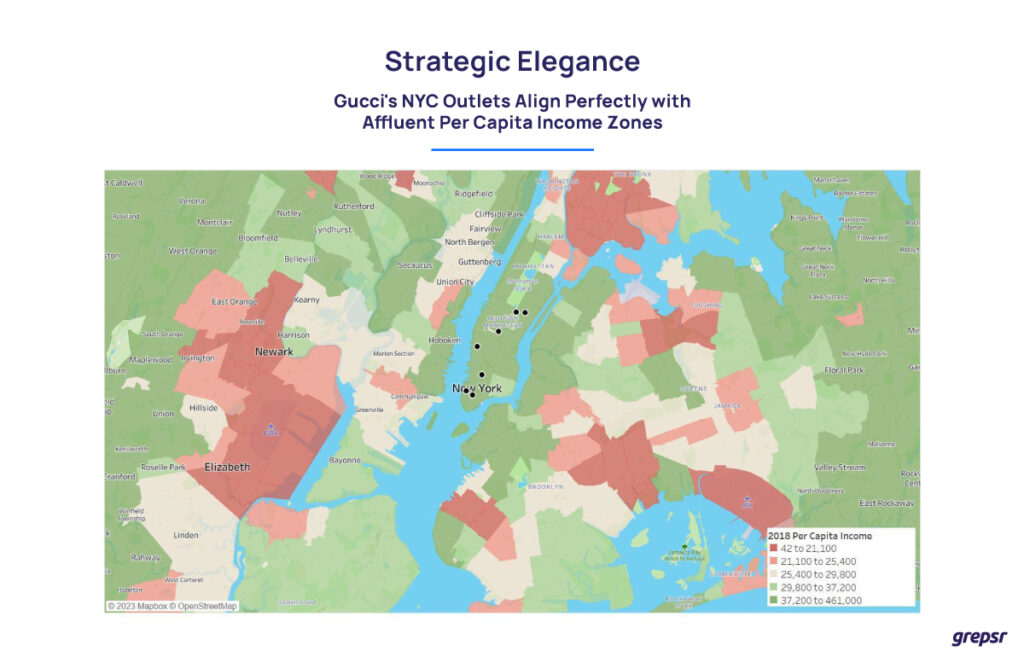
This alignment reinforces the conventional wisdom that high-end brands strategically position themselves in locales where the economic profile aligns with the capacity to indulge in luxury fashion.
Where to now?
We live in intriguing times. Technological innovations arrive in rapid succession, disrupting established business models and creating fertile ground for new, adaptable approaches to thrive. Change is the only constant, and POI data is no exception.
With the swift ascent of Augmented Reality (AR) and Virtual Reality (VR), POI datasets are not merely tools for swift business decisions; they are shaping the world we inhabit and giving rise to a new realm—the metaverse.
In both cases, the power of AR and VR is fueled by vast datasets. This prompts a natural question: How much data is enough? We believe the appetite for data is insatiable, but that’s a blog for another day.


